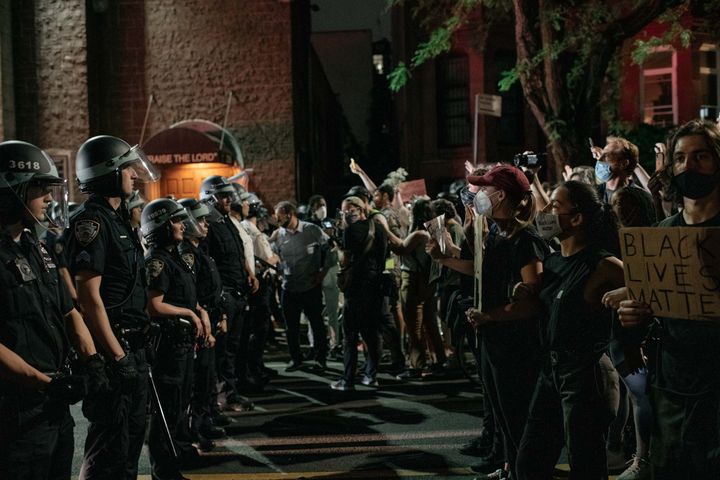
Breonna Taylor was a tax-paying citizen of Louisville, Kentucky. She paid a five percent income tax on her salary as an emergency medical technician, and a six percent sales tax on most purchases. In return, the city of Louisville provided her with streets, parks, sanitation, and funding for a police department. On March 13, the Louisville Metropolitan PD broke into Taylor’s apartment to serve a “no-knock” warrant on the wrong address. The three officers—trained, hired and armed with her tax dollars—shot her eight times while she was lying in bed and killed her.
There has been little progress in the six years since Michael Brown killing in Ferguson, Missouri made police violence into a mainstream political issue. We know names like Freddie Gray, Eric Garner, Alton Sterling and Tamir Rice, but neither their deaths nor the deaths of so many others have led to the kind of reforms sought by the majority of people who now say they support the Black Lives Matter movement. While data collected by The Washington Post since the Ferguson shooting shows that over 1,000 people are shot and killed by police every year, just 98 nonfederal law enforcement officers were arrested between 2005 and March 2019 in connection with fatal, on-duty shootings. As of last year, 35 of those arrested were convicted of a crime—often a lesser offense, such as manslaughter—and only three were convicted of murder.
The growing calls to defund the police are a natural progression in the protest demands. After all, rampant police misconduct is a tremendous waste of money—for example, police department lawsuit settlements cost taxpayers in the three largest U.S. cities $300 million in 2019. Policing expert Alex S. Vitale noted recently that the Minneapolis Police Department’s killing of George Floyd and the resulting counter-response to protesters came after a three-year, multi-million dollar program of procedural reforms. Discussions of defunding the police can benefit from more knowledge of how much we spend on law enforcement—overall and as a share of municipal budgets—and some idea of how much we should spend. We assembled 473 budgets from the official websites of U.S. cities in all 50 states to look at these questions.
Our review started with a list of cities with protests over the killing of George Floyd, and expanded to 473 cities that are widely representative of the country in terms of income, population, and racial diversity. The full list of city names, municipal budgets, and demographic data can be accessed on the project’s GitHub and is detailed in the methodology section below. While previous analyses of city budgets, such as a report undertaken recently by the New York Times, have used a dataset of 150 cities assembled by a nonprofit private foundation, to our knowledge this report’s dataset of 473 city budgets is the largest and most current such dataset.
Across Country, Police Get One-Third of City Spending
Every municipal budget we examined starts with a general fund, where all income (tax revenue, primarily) goes by default. The general fund is legally designated to cover the mundane essentials of local government, including the city council, municipal courts, and the department of inspections. Budgets are complicated documents, designed to assure everything that needs funding gets funding, and that funding designated for one purpose doesn’t get diverted somewhere else. Smaller places with less complicated budgets can run their entire government out of the general fund, while the general fund of larger cities may be less than half of the total budget, which may include funds for things like capital projects, public works, and pensions. But at the core of every budget is a general fund.
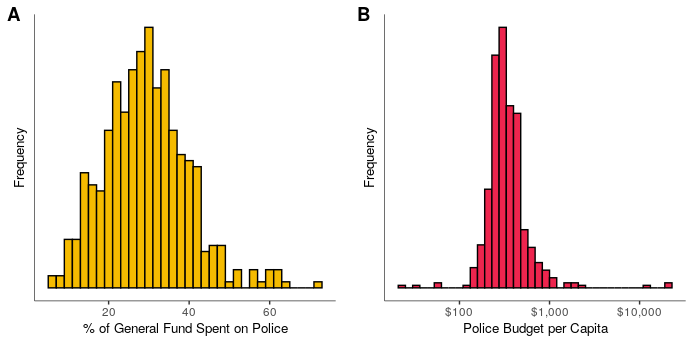
The American municipalities we investigated dedicated an average of 30 percent of their general fund to law enforcement. Most spent between 18 percent and 40 percent. On average, this is $477 per person.
In the 2020 fiscal year, the city of Louisville, Kentucky spent $186.7 million of its $620 million general fund (about 30%) on its police department. That was the city’s largest single allocation by far, followed by the $59.6 million provided for the fire department. Meanwhile, Louisville gave around $20 million each to public health and the public library.
Minneapolis paid $179 million in 2019 for a police department which included the officers who killed George Floyd so egregiously that they set off a generational anti-police protest movement. As with Louisville, the Minneapolis police got more of the city’s $510 million general fund than anyone else. Only $69 million went to the fire department, while $36 million went to road maintenance and repair.
Baton Rouge, whose officers killed Alton Sterling in 2016, gave its police department $93 million for 2020 (29 percent), while dedicating $5.5 million to both prison medical services and juvenile services.
Cleveland spent 32.5 percent of its 2019 general fund on a department that shot 12-year-old Tamir Rice dead while he was playing with a cap gun.
Even Ferguson, Missouri appropriated a third of its 2020 general fund (about $4.5 million out of $13 million) for law enforcement.
This trend extends beyond the locations of the most tragic police killings of the last decade.
Police Get Dominant Share of City Budgets
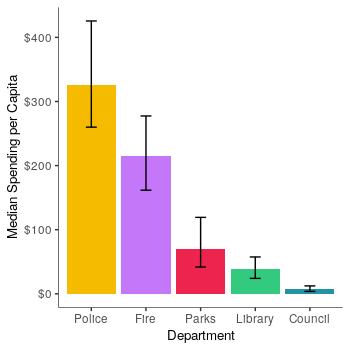
For context on local police spending, we looked at the per capita spending for five budget items commonly found in the general fund in 103 of our 475 cities: police, fire, parks, libraries, and city council. Police departments consistently get the most money, with only the fire department coming close.
With renewed urgency prompted by the waves of “defund” protests, cities are beginning to plan what is likely to be a multi-year process of re-allocating funding from current police departments to community-led health and safety programs. Our analysis raises some questions about how municipal governments make decisions about budgeting for police. To understand this process, we ran some statistical models to see whether variables like income, racial diversity, voting, and violent crime are associated with police spending.
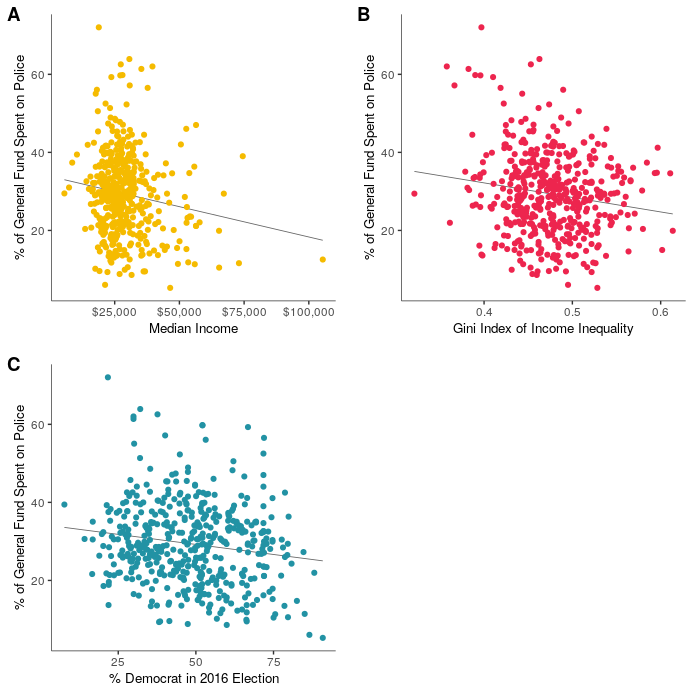
First, we found a relationship between relative police spending and both median income and income inequality: Cities whose residents have less money and also have less income inequality, and thus are more uniformly poor, devote a larger percentage of their general funds to law enforcement. Roughly, we found that for every $10,000 increase in median income, the percent of the general fund spent on police goes down by 1.5%.
Municipal budgeting is typically a zero-sum game, and what gets spent on policing does not get spent on community health, housing, education, or any of the myriad other responsibilities of a local government. A central argument for defunding is that much of what is considered (and approached as) “crime” by police could be better handled by social workers, homeless outreach, or counseling programs. Given sufficient resources, social services could be as effective (if not more so) at preventing crime than the police. As it is, the statistical connection between poverty and increased police spending means the governments whose citizens need the most assistance are funneling more of their money to the cops.
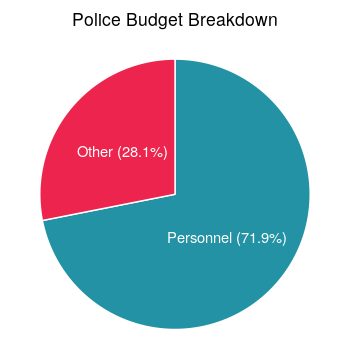
Given the valid concerns about militarization and surveillance, one might expect to see police spending liberally on artificial intelligence software tools, public surveillance cameras, and body armor. In fact, most police funding goes to personnel. In the same 103 city subset as above, local police spent an average of 71.9% on wages, benefits and other compensation.
Crime and Police Budgets
The most interesting revelation from our modeling analysis is the disconnect between police budgets and violent crime per 1,000 residents. Cities that allocated more of their general funds in the past three years to police did not experience more or less crime in any predictable pattern, using data on violent crime from the National Archive of Criminal Justice Data for 2016.
Figure 5: Interactive – hover for details. No correlation between percent of the general fund spent on police and violent crime. View in own tab
This is, admittedly, tough to interpret. By conventional logic, a better equipped police department should not only decrease crime, but also keep the crime rate low and prevent crime from surging. Two places could have very different baseline crime rates, and it could theoretically take very different amounts of money to achieve the same level of crime. Comparing the most-recent available city budgets, from 2020 or 2019, to county-level crime data from 2016 doesn’t give us enough information to draw strong conclusions.
However, there is significant evidence that the conventional logic is wrong, and that crime and police budgets are not meaningfully coupled. Crime rates began falling in America in the early 1990’s and continue to be historically low. National police spending, on the other hand, has been increasing steadily since the late 1970’s, and continued on that upward trend even after crime started to decline. Those trends aside, there are good reasons to question the idea that a police department with more resources will fight crime more effectively. A 2016 study in the Journal of Experimental Criminology of the size of police forces between 1968 and 2013 determined that adding police was an ineffective approach to fighting crime. Another 2018 study, in the Proceedings of the National Academy of Sciences, found police militarization made neither police nor civilians any safer, but did degrade the department’s relationship with the community.
Figure 6: Interactive – scroll/pinch to zoom and hover for details. Percent of the general fund spent on police around the United States. View in own tab
If cites aren’t dedicating more of their resources to police to fight crime, what is driving the trend? Our analysis (see Figure 3C above) suggests a straightforward answer: Municipalities in counties which leaned Republican in the 2016 election spent significantly more of the general fund on their police departments. Roughly, for every 16 point increase in voting Republican there’s a 1.6 percent increase in the share of the general fund spent on police.
This isn’t shocking, given the GOP’s affinity for the Thin Blue Line and ambivalence about social services, but it does clash with the conventional framing of over-policing as a problem of larger cities, which tend to lean Democrat. More interesting still, as detailed in the results section below, we found no significant correlation between racial diversity and relative police spending. While law enforcement is where the rubber most obviously meets the road regarding white supremacy in America, police budgeting appears to be a more universal problem.
Our analysis decoupling police spending and racial diversity should not be interpreted as any kind of refutation of the well-documented anti-Black racial bias in policing. The most underpaid cop in the most underfunded precinct is still entirely capable of abusing their power, then dodging consequences through institutional support. Nor are we implying that better-funded police aren’t explicitly a threat to people of color.
Figure 7: Interactive – scroll/pinch to zoom and hover for details. Average percent of the general fund spent on police at the state level. View in own tab
Our review shows that city officials begin the process of doling out municipal funding by allocating nearly a third of the money to local police. This is true of budgeting in cities big and small, in locales urban, suburban and rural. The only glaring exception to this consistency is at the state level. Virginia, Massachusetts, Vermont and Maine all notably fall on the low side of the data, and preliminary models found significant state-level differences for 25 states as well.
These findings can be interpreted as evidence in favor of shifting taxpayer funding away from expensive personnel costs associated with traditional policing, which have not been shown to correlate with lower violent crime rates. At best, that money goes to pay police who owe their jobs to inertia and political posturing, not an actual need for traditional police personnel costs. At worst, that money goes to killing a civilian, and then paying overtime when the protests start.
Special thanks to Ara Kim, Kaye Kagaoan, Raquel Fraktas, Tierney Smith, Kalkutta and Brooke Lasher for all their help.
Methodology
The term “city” should be understood as a generalized term for a municipality, interchangeable with “town”, “village”, “borough” or any other official designation. The 473 cities were selected at first from the Lists of George Floyd protests page on Wikipedia, then by stratified convenience sampling to improve representation by state, city size and city type. The subset of 99 cities used for the general fund breakdown were selected arbitrarily from the larger data set, but we believe they are a representative sample. All data come from official budget documents downloaded from municipal websites. Most budgets are from FY 2020, but older data was used when more recent data was unavailable. No data is older than 2018.
City-level demographic data came from the US Census API. The frequency distribution of city populations approximates an exponential decay function so populations were log-transformed for all statistical analyses. City-level urbanization index came from FiveThirtyEight. County-level presidential election voting data for 398 counties from 2016 came from the MIT Election Lab. Two counties in Alaska that did not have voting data were assigned the national average. County-level violent crime data came from the FBI and the National Archive of Criminal Justice Data. Each city in the dataset was geocoded using the Google Maps API.
This report’s main analyses were conducted using general linear modeling (GLM). The percent of the general fund spent on the police was the outcome variable, while population size, urbanization, median income, Gini index of income inequality, violent crime per 1,000 residents, percent of the population that is non-white, and percent of the population voting Democrat in the 2016 election were used as predictor variables. All variables were scaled and centered prior to modeling so that estimates would be comparable. Variance inflation factor analysis identified significant collinearity between population and urbanization (VIF > 2), so we excluded urbanization from the modeling. We ran GLM models with every possible combination of predictor variables, ranked them by Akaike’s information criterion (AIC), and used the model with the lowest AIC to identify statistically significant relationships. These relationships were reported as Pearson correlations in the main text to maximize readability by the general public. We re-ran each correlation 10,000 times with a random subset of 75% of the data to ensure the results are robust to sampling error.
To determine whether there are significant differences in the percent of the general fund spent on the police at the state-level, we conducted multinomial logistic regression with percent spent on police as the predictor variable and state as the outcome variable. p-values for each state were calculated using Wald tests.
All analyses were done in R (v 3.6.1). The data collected and used in the analysis can be seen on the project GitHub page.
Results
A total of 473 cities, representing all 50 states, were included in the analysis. The average percent of the general fund spent on the police is 29.39%, the average police budget per capita is $476, and the average general fund per capita is $2,349 (see Figure 1). 80% of cities spend between ~16% and ~42% of their general fund on the police.
Below is a breakdown of the median spending per capita for the police department, fire department, parks and recreation, library, and city council for a subset of 103 cities (see Figure 2), as well as the average percentage of police budgets spent on personnel (see Figure 4). NA values were excluded from the calculations (police: 0%, fire: 0.97%, parks: 4.85%, library: 33.01%, council: 0.97%, police personnel: 29.13%).
Below are the descriptive statistics for the predictor variables included in the GLM (Table 1), as well as the results of the best fitting GLM with the lowest AIC, which included population, median income, Gini index of income inequality, percent voting Democrat in the 2016 presidential election, and violent crime per 1,000 residents as predictor variables (Table 2).
| Mean | Std. Deviation | |
| Median Income | 28,737.07 | 9,973.68 |
| Gini Index of Income Inequality | 0.47 | 0.045 |
| Percent Non-white | 30.05 | 17.74 |
| Percent Voting Democrat in 2016 | 48.36 | 15.91 |
| Violent Crime per 1,000 Residents | 4.00 | 2.61 |
| Estimate | Std. Error | t-value | p-value | ||
| Population | 1.22 | 0.54 | 2.24 | 0.026 | * |
| Median Income | -1.52 | 0.50 | -3.03 | 0.0026 | ** |
| Gini Index of Income Inequality | -2.085 | 0.49 | -4.30 | <0.0001 | *** |
| Percent Voting Democrat in 2016 | -1.56 | 0.55 | -2.86 | 0.0044 | ** |
| Violent Crime per 1,000 Residents | 0.95 | 0.52 | 1.85 | 0.065 |
The four statistically significant predictors were run separately as Pearson correlations to report in the main text. There are significant negative correlations between the percent of the general fund spent on the police and median income (R = -0.15, p = 0.0012), Gini index of income inequality (R = -0.16, p = 0.00051), and the percent of the population that voted Democratic in 2016 (R = -0.16, p = 0.00060) (see Figure 3).
The relationship between the percent of the general fund spent on the police and population is only significant in the GLM, not in the correlation (R = 0.074, p = 0.11). Most interestingly, violent crime per 1,000 residents is not significantly correlated with the percent of the general fund spent on the police (R = 0.073, p = 0.11) (see Figure 5). Interactive maps with all of the cities included in the analysis, as well as state-level budget trends, can be seen in Figures 6 and 7, respectively.
The results of the multinomial logistic regression indicate that there are significant state-level differences in the percent of the general fund spent on the police for 25 states (ps < 0.05), although these results should be interpreted with caution given the extremely low sample size for some states.
Related coverage on Sludge:
Law Enforcement PACs Give Millions to the Politicians Who Set Their Budgets
Verizon and AT&T Partner With Pro-Police Militarization Lobbying Group
Corporate Backers of the Blue: How Corporations Bankroll U.S. Police Foundations