As the dust of the midterm elections settles, the 2018 cycle will be remembered as the most expensive midterm on record.
Roughly $5.2 billion has been spent on this election cycle, a 35 percent increase from the 2014 midterms, according to the Center for Responsive Politics.
The 2017 special election for Georgia’s 6th Congressional District set bar as the most expensive House race ever, with candidates and campaign committees spending roughly $50 million. During the 2018 midterm elections, the most expensive House race so far is California’s 48th, where Republican Rep. Dana Rohrabacher is on track to be defeated by Democratic challenger Harley Rouda.
Rohrabacher, who has been called “Putin’s favorite Congressman” is trailing behind Rouda. But despite the widening gap, Rohrabacher’s campaign told the San Diego Union-Tribune that they are waiting until every ballot is counted.
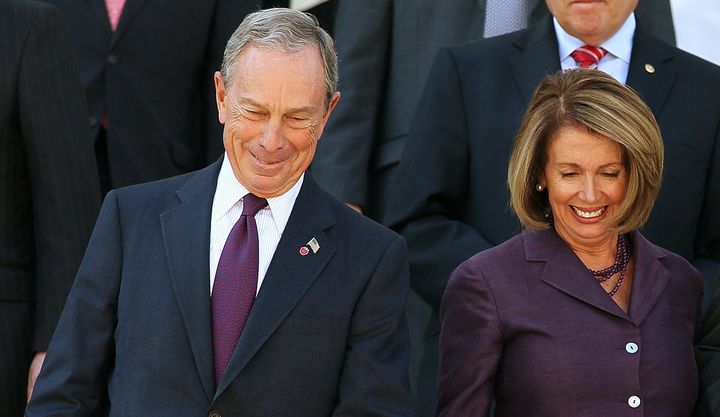
The Rohrabacher and Rouda campaigns spent nearly $9 million, while outside groups—like Michael Bloomberg’s super PAC and committees associated with congressional Democrats and Republicans—spent $19.9 million, bringing the total cost of the race to $28.9 million.
While California was home to the most expensive midterm House race, the cost per vote was highest in Maine, with California trailing closely behind, according to Sludge’s analysis of campaign contributions and independent expenditures tallied by ProPublica. Maine’s two congressional races netted a combined 615,000 votes as of Wednesday evening. Candidates, campaigns, and outside groups spent a combined $22.3 million, meaning that each vote cast for congressional candidates in Maine cost $36.34.
California closely trails Maine for most expensive votes. Candidates and outside groups spent a combined $253.4 million on the 53 congressional races in the Golden State, meaning each of the nearly 7 million votes cast cost $36.11. Five House races in California had total spending of more than $20 million from candidates and outside groups seeking to bolster their preferred candidate. In all, 33 of California’s 53 congressional districts cost more than $1 million.
The race for California’s 10th Congressional District, which attracted $22.9 million in total spending, had the nation’s highest cost per vote. Republican Rep. Jeff Denham is waiting on the results of mail-in ballots to see if his slight lead will hold over Democratic challenger, Josh Harder, keeping the seat in GOP control in a blue state.
The candidates spent a combined $9.5 million, while outside groups spent $13.4 million bolstering their preferred candidates through independent expenditures. As of Wednesday, 112,115 votes were cast in the 10th Congressional District, according to unofficial results available with the California Secretary of State, meaning each vote in the race cost $204.68.
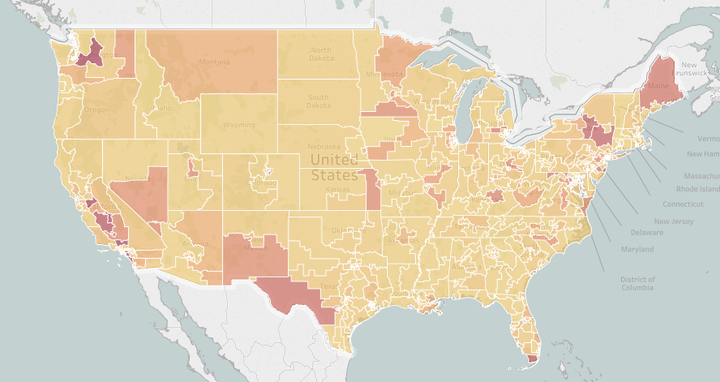
Hover over the map to see how much votes for Congress cost by state during the 2018 midterms. A more detailed map on the costs per vote in specific congressional districts is further below.
Meanwhile In Vermont, the 278,000 votes cast for the state’s only congressional district cost $2.43, making it the least expensive state for votes during the midterm cycle.
Zoom in, or use the drop down and toggle function, on the map to see how much a vote cost in a specific congressional district.
Methodology: Sludge compiled spending data for every House race this cycle, using information available on ProPublica’s FEC Itemizer, which takes into account candidate spending and independent expenditures, as of Wednesday evening. Voting results came from each state’s Board of Elections or an equivalent agency, accessed between 11/7 and 11/8, and are considered unofficial, meaning that they might not capture the full vote tally and are subject to change. Pennsylvania’s 17th and 18th Congressional Districts were not included in the calculation because the Pennsylvania Supreme Court struck down the state’s congressional district map due to gerrymandering and adopted a new map, making it difficult to discern what spending was for the special election and what was for the general.
Update, Sat. Nov. 10th: this article originally identified Rep. Denham’s Democratic challenger in California’s 10th district as Michael Eggman. The candidate is Josh Harder.